Questions/Answers
1. How the dice are generated

The system used by GammonSite to generate the dice is based on a pseudo random number generator. The way a pseudo random generator work is the
following:
The generator is initialized with a seed. Each time the generator is called it uses the seed to get 2 number, the result and a new
seed. This new seed will determined the next result. Seed and result are integer and can take any value between 0 and 2^32-1 (so about 4.3 billions different value).
In case of the dice generator the result is taken modulo 6 and 1 is added so the result is between 1 and 6.
2. Why is it called "pseudo-random"
The system described above is called "pseudo" random because there is limited number of dice sequence it can
generate, but this number is so
big that the difference is very small.
For instance, after having played 1000 games the chances that you get the same dice sequence more than once is one out
of 8616.
To have more than a 10% chance to get the same sequence of dice as in a previous game, you need to play in average 40,000 games.
No human can detect such low frequency pattern. That's why pseudo random number generators are a very adequate solution to dice generator for backgammon.
3. Statistics.
Here are the dice statistics that the computer players,
or "bots" had. This is a good example because this data is real life data in a real game context.
Note: The 1st roll of the game is discarded for statistics purposes.
|
Dice |
Real |
Real
% |
Theory
% |
Delta
% |
Err |
Value
Expected |
Difference |
one more or
less each
|
| 1s |
3,940,196 |
16.67336% |
16.66667% |
0.00669% |
0.04015% |
3,938,615 |
1,581 |
7,472 |
| 2s |
3,936,754 |
16.65879% |
16.66667% |
-0.00787% |
0.04724% |
3,938,615 |
-1,861 |
6,350 |
| 3s |
3,941,678 |
16.67963% |
16.66667% |
0.01296% |
0.07778% |
3,938,615 |
3,063 |
3,857 |
| 4s |
3,937,078 |
16.66016% |
16.66667% |
-0.00650% |
0.03902% |
3,938,615 |
-1,537 |
7,689 |
| 5s |
3,938,810 |
16.66749% |
16.66667% |
0.00083% |
0.00496% |
3,938,615 |
195 |
60,491 |
| 6s |
3,937,172 |
16.66056% |
16.66667% |
-0.00610% |
0.03663% |
3,938,615 |
-1,443 |
8,190 |
| Total
Dice |
11,815,844 |
|
|
Max |
0.07778% |
|
|
|
|
Double |
Real |
Real
% |
Theory
% |
Delta
% |
Err |
Value
Expected |
Difference |
one more or
less each
|
| 11s |
328,096 |
2.77675% |
2.77778% |
-0.00103% |
0.03714% |
328,218 |
-122 |
96,939 |
| 22s |
327,213 |
2.76927% |
2.77778% |
-0.00850% |
0.30617% |
328,218 |
-1,005 |
11,758 |
| 33s |
329,498 |
2.78861% |
2.77778% |
0.01083% |
0.39002% |
328,218 |
1,280 |
9,230 |
| 44s |
328,300 |
2.77847% |
2.77778% |
0.00069% |
0.02502% |
328,218 |
82 |
143,901 |
| 55s |
327,861 |
2.77476% |
2.77778% |
-0.00302% |
0.10874% |
328,218 |
-357 |
33,108 |
| 66s |
327,667 |
2.77312% |
2.77778% |
-0.00466% |
0.16784% |
328,218 |
551 |
21,449 |
| Total
Double |
1,968,635 |
16.66098% |
16.66667% |
-0.00569% |
0.03414% |
1,969,307 |
-672 |
17,574 |
Double
in
a row |
Real |
Real
% |
Theory
% |
Delta
% |
Err |
Value
Expected |
Difference |
one more or
less each
|
| 1 double |
1368106 |
11.57857% |
11.57407% |
0.00450% |
0.03886% |
1,367,575 |
531 |
22,233 |
| 2 doubles |
227465 |
1.92508% |
1.92901% |
-0.00393% |
0.20361% |
227,929 |
-464 |
25,460 |
| 3 doubles |
37941 |
0.32110% |
0.32150% |
-0.00040% |
0.12420% |
37,988 |
-47 |
250,433 |
| 4 doubles |
6318 |
0.05347% |
0.05358% |
-0.00011% |
0.21107% |
6,331 |
-13 |
884,181 |
| 5 doubles |
1048 |
0.00887% |
0.00893% |
-0.00006% |
0.68490% |
1,055 |
-7 |
1,634,898 |
| 6 doubles |
175 |
0.00148% |
0.00149% |
-0.00001% |
0.49537% |
176 |
-1 |
13,562,551 |
| 7 doubles |
26 |
0.00022% |
0.00025% |
-0.00003% |
11.29873% |
29 |
-3 |
3,567,727 |
| 8 doubles |
4 |
0.00003% |
0.00004% |
-0.00001% |
18.12190% |
5 |
-1 |
13,346,540 |
| 9 doubles |
0 |
0.00000% |
0.00001% |
-0.00001% |
100.00000% |
1 |
-1 |
14,511,882 |
Note: on the double in a row. The probability to roll exactly N double in a
row is p=5/6 x (1/6)n x (5/6)=25/6n+2 which correspond to
- not roll a double on the previous roll : 5/6
- Roll N double in a row 1/6n
- End the sequence with a non double 5/6
This means that a series of doubles can be counted
over two games (remember the 1st roll is always discarded and so doesn't interrupt
the series).
Analyze on the
double
Let's consider the event of rolling a double or not. We affect
the value 1 if we roll a double, the value 0 otherwise.
By the central limit theorem, in this context the sum of a large number of independent random variables may
be approximated by a normal distribution.
f(x)=[1/(Ö2ps)]exp-(x-m)²/(2s²)
where is the standard deviation s
and the m
mean.
The standard deviation of the number of independent events which occur is
s=Ö(p-p²)ÖN
if each has probability p and there are N events.
The probability to have a difference of X or less to the average is
| G(X) = |
ó
õ |
+X
-X |
f(u) du. |
For
X=1s G(X)=68%
X=2s G(X)=95%
X=3s G(X)=99.7%
For our
sample with N=11,815,8411 as p=1/6
we have
s=1281.05
It means that if you repeat this test 100 times, you
will have a
number of
doubles between 16.65582% and 16.67751% 68% of the time.
If you make the statistic out of 1000 rolls only, you will have a number of
double between 15.48816 and 17.84518% 68% of the time, so in 32% the difference
to the average will be more than
s
=11.79. There is
only 0.3% chances that you have 3s=35.36 doubles more (or less) than the average (166.66)
A procedure to determine the size of a sample that could show if the
results are biased.
From a sample out of N rolls, we can calculate the average. If we assume
that this average truly reflects this random distribution we can trace both
distribution curve, f(X) for p=1/6 (the pure random one) and h(X) for p=the
average of the sample.
In our case from the sample above p=1/6.002049.
The graph below show the distribution for N=11,815,8411 .
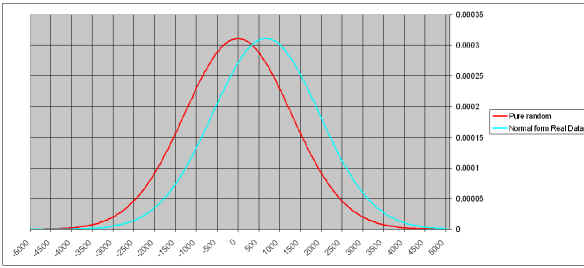
The curves overlap of 79.30%. If we want to make sure the sample
function give different result than the random one, we need to find a N big
enough for the curves to overlap less than 5% (a common security interval in
statistics).
we find N=655,000,000.
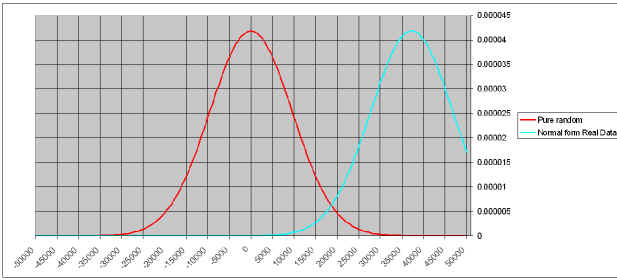
A sample made out of 50,000,000 rolls give a X (difference to the average) of
-1836 (s=2635) and a average double % of 16.6622% (on
the 1st sample we had 16.6609%). Here is the raw data:
| |
Total |
Doubles |
|
Double
in a row |
|
| 1 |
16,669,131 |
1,388,826 |
|
1 |
5,786,264 |
| 2 |
16,665,525 |
1,386,130 |
|
2 |
963,451 |
| 3 |
16,670,364 |
1,391,307 |
|
3 |
160,894 |
| 4 |
16,669,295 |
1,388,794 |
|
4 |
26,818 |
| 5 |
16,662,097 |
1,388,012 |
|
5 |
4,495 |
| 6 |
16,664,384 |
1,388,495 |
|
6 |
812 |
| |
50,000,398 |
8,331,564 |
|
7 |
128 |
| |
|
|
|
8 |
24 |
| |
|
|
|
9 |
1 |
Quite logically, the % gets closer to the expected value.
If we repeat the
procedure above, it tells us now that we need to work with a 1.1 billion roll
sample to have a chance to rule the pure randomness out.
4. Why noticeable sequences appears to humans.
The randomness is a concept very hard to grasp. If you present to a group of people the following example: I flip a coin 5 times and those 5 time the coin shows head, for the next flip do I’ve more chance to have head or tail. You will see that a lot of people will tell you that tail is more probable. And it is not !
Most people confuse randomness and statistic. Yes, the statistics says that it's more likely to have 5 times head and one time tail than 6 times heads. But that’s not the question here because the unlikely event (5 time heads) has already happened and the coin
doesn’t have “memory” of it.
Because the concept of randomness cannot be apprehended by the mind in any logical way, there is a tendency to try to rely on
patterns. In the case of dice rolls, it is very easy to think you see patterns because there is few different roll and numerous way to see a pattern.
For instance the following event can be considered as pattern
N rolls with at one value always showing (for instance 5 rolls with a 1)
The probabilities that this pattern appear at any times can be calculated as
follow:
- If the 1st roll is a double (p=1/6) the probability to get the N-1 rolls having this value is
(11/36)N-1.
- If the 1st roll is not a double. The chance on the second roll to get one of the 2 numbers rolled previously is 20/36.
For the next roll, the chance to get the same number
rolled is 11/36 so P=20/36.(11/36)N-2 (note: for
simplification we don't take into account the case the player roll the same
dice)
Overall the chances to get the same value in N rolls is
P=1/6.(11/36)N-1+5/6.20/36.(11/36)N-2
Or
P=(11/36)N-2.(1/6.11/36)+5/6.20/36)
P=(11/36)N-2.(111/216)
N roll with the same value
N=3 15.7%
N=4 4.8%
N=5 1.47%
Even if for N=5 the value shown is small, what happens is that there
are so
many different possible patterns that all together there is little chance to
not see any of these patterns appear on 5 rolls.
Very roughly : if there are 10 pattern set, each of them having a
probability of 3% the chances that at least one appear is 27% (this is
true only if the patterns are independent events).
Also, very often, a pattern is broken and the player forgets about that.
A typical example is series of double, for instance 3 doubles out of 4 rolls. A
lot of players will "forget" the non double they got and claim they had 3 doubles in
a row. The probability to get 3 double in row is 1/216=0.46% while the probability
to get 3 doubles out of 4 rolls is 1.54%, 3.33 times bigger !
5. Commons misconceptions made in Backgammon
Assume that the dice have a memory
Because people know that they are supposed to roll a specific dice 11 times
out of 36, some might assume that because they have not done so in the previous
rolls, they have more of a chance now to get the dice they want. This is a common
misconception that assumes that the dice has a memory of what happened.
This is a different case than with slot machine. Slot machines don't use randomness
in the mathematical sense. They are programmed to give out of a fixed number of
sample a predetermine number of each combinations. This is not cheating, it just
insures the casino how much they will win but it also insures the player that it
will win the jackpot after a fixed amount of tries. Though this can not be
called randomness.
Random dice are not program that way. Each roll is independent of the whole
past and will not affect the future. To compare the 2 methods, dice and slot
machines, you can image a bag with 5
red balls and 1 white one, you win if you pick the white one.
- Random Dice equivalent: each time you pick a ball check if you win and put
the ball BACK in the bag
- Slot machine equivalent : you pick the ball and do NOT
put it back in the
bag.
In the second case you know you will win exactly one time after 6 tries. In
the second case you cannot be sure of anything. The laws of probabilities tell you that
you will win one time out of 6 in average. But if you have lost 5 times your
chances to win next time are exactly the same than at the beginning of the game:
1 out of 6.
Focusing on one event.
Players complain about the dice when an unlikely event occurs. But they forget to see the overall picture. Let say I roll 36 rolls and get 6 doubles , two of them being in row. If I focus on those 2 rolls I will say that this unlikely event happened which defied the probabilities. Though if I get the whole picture I will realize that after all the probabilities are respected.
It is of the up most importance when make statistic
to pick the sample data in an objective way. It mean that if you want to analyze
dice statistic don't pick the game you have seen a lot of double. the best way
to choose games for dice analyze is to decide to pick, in advance, all the game
you will play between 2 dates.
There are too many double in a row.
A little anecdote to start: in the 80's a casino player in Monte-Carlo
started playing roulette. he put $1000 dollars on the red. The balled stopped on
red and he got paid his $1000, he decide to let the total, $2000 on red. Red
came again and now he is betting his $8000 still on red. of Course the little
ball stopped on red... Believe it or not, Red get out 18!! times in a row....
but only 18, the 19th try was black and the player lost his 262 millions dollar
bet.
This event had only one chance out of 524288 to
occurs (ignoring the chance to get a 0 which is neither red or black in the
roulette game). But it did, out of
the all the casino in the world with thousand of player gambling this kind of
unlikely event will always happen.
Most people see an unlikely event at it, without considering the number of
time this event might occur. If the sample is big enough any event will occur,
even if the event has a very low probability. When ever this event occur (and it
will) player tent to focus on that forgetting completely that the event never occurred
before.
For instance, let's consider the probability during an average game (30 move for each player) that one of them get 4 double in a row.
To compute that value we compute the opposite probability that this event never happens.
The chance P that someone roll 4 doubles is 1/64. The chances that each roll I don’t start a 4 doubles a row sequence is 1-P
The chance that this never happened in the 30 moves of one player is Q=(1-P)30
The chance that it doesn’t happened for either player is Q2
Thus the chances that one player got 4 double in a row is R=1-Q2
Numerically R= 4.5%
This is not a very probable event, but this will happen quite often.
If we
consider a series of 10 games and want to know the probability that this event
do NOT occur we make the simple calculation P=(1-r)10=63%
Statistically to have 50% chances to see 4 doubles in a row you need to play 15 games.
If you make the same computation for 7 doubles in a row :
R=0.021%
To have a 50% chance of seeing 7 doubles in a row, you need to play 3235 games.
A player with 20000 games has a 12% chance to see 9 doubles in row !!
I roll double when I am on the bar and dance.
When you are on the bar with one checker , rolling a double is not good. For instance against a 4 point board.
Overall the chance to enter are 20/36=55.5%
If you roll a double you have 2/6 to enter=33.3%
If you don’t roll a double you have 18/30 to enter=60%
The consequence of that is that double rolls for the bar are usually useless, so even if you don’t
roll more double when on the bar, because of all those wasted double people get
the feeling that they get more doubles when on the bar.
Player interpret that as "When I am on the bar I roll more doubles
than normal and I cannot even use them", while they should say "I am
on the bar, I hope I won't roll a double".
My opponent won a race while it was 25 pips
behind. That's not possible.
First there are 2 things to consider about pip count.
- The current pip count (a 25 lead is more significant on a 80-105 race,
than on 100-125 race).
- The wasted pip. During bear-off it is very likely that player will waste
pip (i.e. bear off a checker in 1 with a 6 and waste 5 pip), so always
consider your potential pip waste.
Now let's assume that this 25 pip lead is without pip wasted for both
players. The player in the lead is on the roll, the pip count is 105-80, out of
1000
simulation the underdog won 80 times, so a 8% winning chances. With a pip of 125
-120 the underdog win in 9.80% of the simulation (note : if the underdog is on
the roll at a 125-100 pip count, he wins 17.6% of the games, the player who is
rolling first have in fact an advantage of 8.166 pip, which is the average pip
won per roll). With a bigger margin, the underdog still can win a few games. For
instance, at 60-100, the underdog still wins about 1% of the games. It doesn't
happen often but it does happen.
This shows that it is always possible to lose a
race, even with a big advantage